阿里刚发布2014年第3季度财报,财报原文SEC 6-K:http://chinastockadvice.com/2014/11/04/baba-6-k-alibaba-group-holding-ltd/
,阿里的Business Wire 新闻发布在最后。
这是IPO后首份财报,阿里营收=RMB168亿元,同比增长54%;核心业务运营利润=85亿元;GAAP净利润=30.30亿元,较上年同期-38.6%;Non-GAAP净利润=68亿元,较上年同期+15.5%。蔡崇信用流利的英语在CNBC上说亚马逊B2C低毛利,但阿里收佣金和广告费高毛利!
阿里在纽约时间11月4日早上7点开盘前发布财报后,纽约时间12点阿里估价上涨>2%至$104,收盘估价上涨>4%,至$106,市值2615亿美元。假设阿里之后每季度净利润=RMB30.3亿元=4.94亿美元,年利润=19.76亿美元,前瞻性Forward-Looking市盈率PE=2615亿/19.76亿 = 132!亚马孙亏损,近12月(ttm)历史市盈率PE:谷歌=29,苹果=17,FB=70,阿里牛!
美国上市的其他公司都是用US GAAP(美国通用会计准则)计算,GAAP都要将期权(员工进行的激励计划)的费用算进去呀,大家都是GAAP,但阿里的PE>130,比其他都高!熟悉美国上市的朋友都知道,Non-GAAP财报是用来忽悠不懂财报的人:你看,我的Non-GAAP利润那么高!//@建春言行: 这利润扣除了30亿的期权费用的,所以PE是66倍。
阿里海外增长倒退,国内增长放缓,所以才需要疯狂并购弥补增长不足。但亚马逊、FB、谷歌等却疯狂在(美国)海外圈地,Organic自身业务营收蒸蒸日上,不需要并购财报。//@中国电子商务网:ALI 赚的那点销售提成不值一提,深知B2C的毛利,所以看扁Amazon的低毛利,人家赚的就是年费,服务费,保证金与广告费
阿里巴巴发布第三季度财报:净利润68亿元
http://tech.sina.com.cn/i/2014-11-04/20329759786.shtml
2014年11月04日 20:32
新浪科技讯 北京时间11月4日晚间消息,阿里巴巴(103.87, 2.07, 2.03%)集团(NYSE:BABA)今日发布了截至9月30日的2014年第三季度财报。财报显示,营收为人民币168.28亿元(约合27.42亿美元),同比增长53.7%。净利润为人民币30.30亿元(约合4.94亿美元),较上年同期下滑38.6%。基于非美国通用会计准则,净利润为人民币68.08亿元(约合11.09亿美元),较上年同期的人民币58.93亿元增长15.5%。
汤森路透(Thomson Reuters)汇总的数据显示,22名分析师平均预计,不按美国通用会计准则计算(Non-GAAP),阿里巴巴第三季度净利润将达11.5513亿美元;财报显示,该公司第三季度净利润11.13亿美元,低于分析师预期。另外,股权奖励支出为人民币30.10亿元(约合4.90亿美元),占营收的17.9%,较上年同期增长了248.4%。而上年同期股权奖励支出为人民币8.64亿元,占营收的7.9%。
另外,27位分析师平均预计,阿里巴巴第三季度总营收将达26.1043美元;财报显示,该公司第三季度总营收为27.52亿美元,高于分析师预期。
阿里巴巴集团首席执行官陆兆禧表示﹕阿里的各项重要运营指标在这个季度均获得了显著增长。在整个中国零售商务平台上,我们本季度的商品交易额(GMV)增幅达48.7%,年度活跃买家数量比去年同期增长了52%。9月份,我们移动商务应用程序的月度活跃用户达到2.17亿,而截至今年9月底的12个月期间,来自移动端的商品交易额达到了950亿美元 (约人民币5,859亿元)。
第三季度业绩摘要:
GMV——中国零售市场的交易总额为人民币5556.66亿元(约合905.29亿美元),较上年同期增长48.7%。其中,来自淘宝平台的交易额为3798.32亿元,同比增长38.2%;来自天猫平台的交易额为1758.34亿元,同比增长77.8%。
移动GMV——移动交易总额为人民币1990.54亿元(约合324.30亿美元),较上年同期增长14.7%。移动端GMV占整体交易额的比例达到35.8%,这一比例较2013年同期提升了21个百分点,比2014年第二季度提高3个百分点。
年活跃买家——在中国零售市场的年活跃买家为3.07亿人,而截至2014年6月30日的12个月的年活跃买家为2.79亿人,截至2013年9月30日的12个月的年活跃买家为2.02亿人。
移动MAU——移动月活跃用户为2.17亿人,高于上一季度的1.88亿人,而截至2013年9月30日的季度为9100万人。
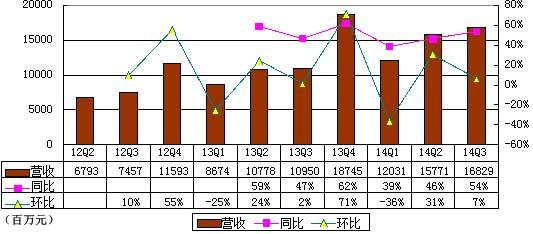
营收——营收为人民币168.29亿元(约合27.42亿美元),较上年同期的人民币109.50亿元增长53.7%。
来自于中国商业零售业务的营收为人民币127.69亿元(约合20.80亿美元),占总营收的75.9%,较上年同期的人民币86.45亿元增长47.7%。
移动营收为人民币37.19亿元(约合6.06亿美元),占中国商业零售业务总额的29.1%,与上年同期的人民币3.32亿元相比增长1020.2%。
运营利润——运营利润为人民币43.45亿元(约合7.08亿美元),占营收的25.8%,较上年同期的人民币52.48亿元下滑17.2%。
基于非美国通用会计准则,EBITDA(息税折旧及摊销前利润)为人民币84.93亿元(约合13.84亿美元),与上年同期的人民币65.05亿元相比增长30.6%。
EBITDA利润率为50.5%,而上年同期为59.4%,上一季度为54.4%。
净利润为人民币30.30亿元(约合4.94亿美元),较上年同期的人民币49.37亿元下滑38.6%。该数据计入了阿里巴巴集团对员工进行的激励计划所涉及的30.10亿元人民币成本。
基于非美国通用会计准则,净利润为人民币68.08亿元(约合11.09亿美元),较上年同期的人民币58.93亿元增长15.5%。
每股美国存托股摊薄收益为人民币1.24元(约合0.20美元),较上年同期的人民币2.13元下滑41.8%。
基于非美国通用会计准则,每股美国存托股摊薄收益为人民币2.79元(约合0.45美元),较上年同期的人民币2.55元增长9.4%。
第三季度业绩分析:
营收为人民币168.29亿元(约合27.42亿美元),较上年同期的人民币109.50亿元增长53.7%。营收同比增主要得益于中国商业零售业务的持续快速增长。
来自中国商业零售业务的营收为人民币127.69亿元(约合20.80亿美元),占总营收的75.9%,较上年同期的人民币86.45亿元增长47.7%。该部分业务的同比增长主要得益于在线营销服务营收和佣金营收的增长。
移动营收为人民币37.19亿元(约合6.06亿美元),占中国商业零售业务总额的29.1%,而截至今年6月30日的季度占19.4%,上年同期占3.8%。阿里巴巴集团移动营收的增长主要得益于移动交易总额的增长,以及移动货币化比率的提升。
来自于中国商业批发业务的营收为人民币7.90亿元(约合1.29亿美元),较上年同期的人民币5.68亿元增长39.1%。该部分业务营收的同比增长主要得益于付费用户数量的增长,以及付费用户平均营收的增长。
来自国际商业零售业务的营收为人民币4.19亿元(约合6800万美元),较上年同期的人民币2.10亿元增长近一倍。该部分业务营收的同比增长主要得益于付费用户数量的增长。
来自国际商业批发业务的营收为人民币11.98亿元(约合1.95亿美元),较上年同期的人民币9.66亿元增长24.0%。该部分业务营收的同比增长主要得益于付费用户数量的增长。
营收成本为人民币55.96亿元(约合9.12亿美元),占营收的33.3%。而上年同期营收成本为人民币30.01亿元,占营收的27.4%。
产品开发开支为人民币25.81亿元(约合4.21亿美元),占营收的15.3%。而上年同期产品开发支出为人民币11.68亿元,占据了营收的10.7%。
销售与营销开支为人民币17.49亿元(约合2.85亿美元),占营收的10.4%。而上年同期销售与营销支出为人民币6.57亿元,占营收的6.0%。
总务及行政支出为人民币19.60亿元(约合3.19亿美元),占营收的11.7%。而上年同期产品开发支出为人民币7.93亿元,占营收的7.2%。
股权奖励支出为人民币30.10亿元(约合4.90亿美元),占营收的17.9%,较上年同期增长了248.4%。而上年同期股权奖励支出为人民币8.64亿元,占营收的7.9%。
无形资产摊销为人民币5.98亿元(约合9700万美元),而上年同期仅为人民币3900万元。无形资产摊销的同比大幅增长主要与公司的战略收购相关,其中包括对UC浏览器和高德软件股权的收购。
运营利润为人民币43.45亿元(约合7.08亿美元),占营收的25.8%,较上年同期下滑17.2%。上年同期运营利润为人民币52.48亿元,占营收的47.9%。
基于非美国通用会计准则,EBITDA为人民币84.93亿元(约合13.84亿美元),高于上年同期的人民币65.05亿元。EBITDA利润率为50.5%,低于上年同期的59.4%,低于上一季度的54.4%。
利息和投资收入为人民币4.68亿元(约合7600万美元),较上年同期的人民币3.18亿元增长47.2%。
利息支出为人民币5.21亿元(约合8500万美元),较上年同期的人民币3.74亿元增长39.3%。
其它收入为人民币3.78亿元(约合6200万美元),较上年同期的人民币3.89亿元下滑2.8%。
所得税支出为人民币13.39亿元(约合2.18亿美元),较上年同期的人民币6.37亿元增长110.2%。有效税率为28.7%,高于上年同期的11.4%。
净利润为人民币30.30亿元(约合4.94亿美元),较上年同期的人民币49.37亿元下滑38.6%。基于非美国通用会计准则,净利润为人民币68.08亿元(约合11.09亿美元),较上年同期的人民币58.93亿元增长15.5%。
归属于普通股股东的净利润为人民币29.76亿元(约合4.85亿美元),较上年同期的人民币48.83亿元下滑39.1%。
每股美国存托股摊薄收益为人民币1.24元(约合0.20美元),较上年同期的人民币2.13元下滑41.8%。基于非美国通用会计准则,每股美国存托股摊薄收益为人民币2.79元(约合0.45美元),较上年同期的人民币2.55元增长9.4%。
截至2014年9月30日,阿里巴巴集团持有的现金、现金等价物和短期投资总额为人民币1099.11亿元(约合179.06亿美元),而截至2014年3月31日为人民币436.32亿元。
截至2014年9月30日,阿里巴巴集团第三季度通过运营活动产生的净现金为人民币58.65亿元(约合9.55亿美元),较上年同期的人民币45.26亿元增长29.6%。
资本支出为人民币33.96亿元(约合5.53亿美元),高于上年同期的人民币11.40亿元。
自由现金流为人民币89.38亿元(约合14.56亿美元),较上年同期的人民币66.83亿元增长33.7%。
用于投资活动的净现金为人民币325.55亿元(约合53.04亿美元),其中投资和收购活动为人民币159.12亿元(约合25.92亿美元)。
阿里IPO后首季财报图解:为何净利下滑?
http://tech.qq.com/a/20141104/081352.htm
2014年11月04日
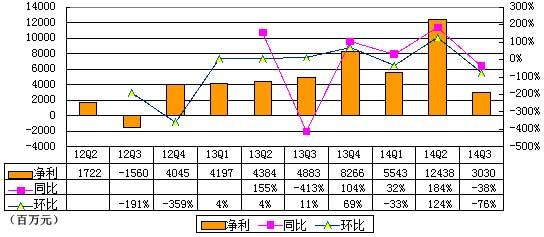
阿里巴巴集团(纽交所证券代码:BABA)今日发布财报。财报显示,阿里巴巴集团第三季营收168.28亿元,同比增53.7%;净利30.30亿元,较上季下降76%,较上年同期下滑38.6%。 阿里集团上季净利124亿元,这个季度明显下降,原因在于,上季计入所持股东权益62.51亿净增长,这项权益与集团分阶段收购UCWeb和OneTouch交易有关,不具有可持续性。 阿里巴巴集团这个季度业绩同比下降的重要原因是,支出30.10亿元用于对员工进行激励。上述费用占阿里巴巴集团当季总收入的17.9%,较上年同期的8.64亿同比增加248.4%。 阿里集团Q3营收168.29亿元 同比增54%
阿里巴巴集团第三季度营收为168.29亿元(约合27.42亿美元),较上年同期的109.50亿元增长53.7%。营收的同比增长,主要受中国商业零售业务持续快速增长的推动。 阿里集团Q3国内营收127.69亿元 占比75.9%

阿里巴巴集团第三季度来自于中国商业零售业务的营收为127.69亿元(约合20.80亿美元),占据总营收的75.9%,较上年同期的86.45亿元增长47.7%。 阿里巴巴集团第三季度中国商业零售业务的同比增长,主要受在线营销服务营收和佣金营收的增长推动。中国零售市场交易总额同比了48.7%,主要受活跃买家数量增长52.0%的推动。 阿里集团Q3 GMV达5556亿元 移动端占比35.8%

阿里巴巴集团第三季度在中国零售市场的交易总额5556.66亿元(约905.29亿美元),较上年同期增长48.7%。移动交易总额为1990.54亿元(约324.30亿美元),占比达35.8%。这一比例较2013年同期提升了21个百分点,比2014年第二季度提高3个百分点。 阿里巴巴集团第三季度移动月活跃用户为2.17亿人,高于上一财季的1.88亿人,高于截至2013年9月30日的9100万人。 阿里集团Q3成本55.96亿 占营收33.3%
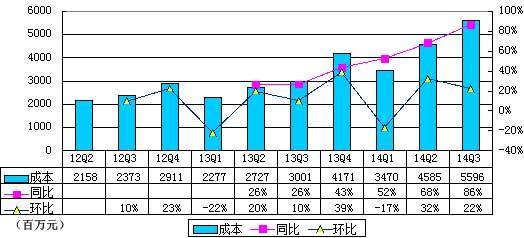
阿里巴巴集团第三季度营收成本为55.96亿元(约合9.12亿美元),占据营收的33.3%。阿里巴巴集团上年同期营收成本为30.01亿元,占据了营收的27.4%。 阿里集团Q3毛利112.33亿元 毛利率66.7%
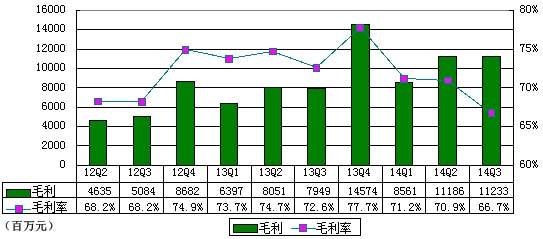
阿里巴巴集团第三季度毛利为112.33亿元,较上一季度有小幅增长,毛利率为66.7%,低于上一季度的70.9%,也低于上年同期的72.6%。 阿里集团Q3费用66.88亿元 同比增155%

阿里巴巴集团第三季度费用为66.88亿元,较上一季度增长59%,较上年同期增长155%。 阿里巴巴集团第三季度产品开发支出为25.81亿元(约合4.21亿美元),占据了营收的15.3%。阿里巴巴集团上年同期产品开发支出为11.68亿元,占据了营收的10.7%。 阿里巴巴集团第三季度销售与营销支出为17.49亿元(约合2.85亿美元),占据了营收的10.4%。阿里巴巴集团上年同期销售与营销支出为6.57亿元,占据了营收的6.0%。 阿里巴巴集团第三季度总务和行政支出为19.60亿元(约合3.19亿美元),占据了营收的11.7%。阿里巴巴集团上年同期产品开发支出为7.93亿元,占据了营收的7.2%。 阿里巴巴集团第三季度股权奖励支出为30.10亿元(约合4.90亿美元),占据了营收的17.9%,较上年同期增长了248.4%。阿里巴巴集团上年同期股权奖励支出8.64亿元,占据营收7.9%。 阿里集团Q3运营利润43.45亿元 运营利润率25.8%
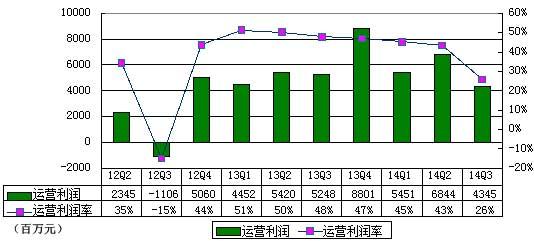
阿里巴巴集团第三季度运营利润为43.45亿元(约合7.08亿美元),占据营收的25.8%,较上年同期下滑17.2%。阿里巴巴集团上年同期运营利润为52.48亿元,占据了营收的47.9%。 阿里集团Q3净利30.30亿元 同比降38.6%
阿里巴巴集团第三季度利息和投资收入为4.68亿元(约合7600万美元),较上年同期的3.18亿元增长47.2%。利息支出5.21亿元(约合8500万美元),较上年同期的3.74亿元增长39.3%。 阿里巴巴集团第三季其它收入为3.78亿元(约6200万美元),较上年同期3.89亿元下滑2.8%。 按照美国会计师准则,净利润为30.30亿元(约4.94亿美元),较上年同期的49.37亿元下滑38.6%。不按照美国通用会计准则,阿里巴巴集团第二财季净利润为人民币68.08亿元(约合11.09亿美元),较上年同期的人民币58.93亿元增长15.5%。 截至2014年9月30日,阿里巴巴集团持有的现金、现金等价物和短期投资总额为1099.11亿元(约合179.06亿美元),高于截至2014年3月31日的436.32亿元。 截至2014年9月30日,阿里巴巴集团通过运营活动产生的净现金为58.65亿元(约合9.55亿美元),较上年同期的45.26亿元增长29.6%。 阿里巴巴集团第三季度资本支出为33.96亿元(约合5.53亿美元),高于上年同期的11.40亿元。的自由现金流为89.38亿元(约合14.56亿美元),较上年同期的66.83亿元增长33.7%。 截至2014年9月30日,阿里巴巴集团在第二财季用于投资活动的净现金为325.55亿元(约合53.04亿美元)。其中投资和收购活动为159.12亿元(约合25.92亿美元)。
Alibaba Group Announces September Quarter 2014 Results
HANGZHOU, China--(BUSINESS WIRE)--
Alibaba Group Holding Limited (BABA) today announced its financial results for the quarter ended September 30, 2014. “We delivered a strong quarter with significant growth across our key operating metrics,” said Jonathan Lu, chief executive officer of Alibaba Group. “Our business continues to perform well, and our results reflect both the strength of our ecosystem and the strong foundation we have for sustainable growth. On our China retail marketplaces, gross merchandise volume for the quarter increased 49% and annual active buyers increased 52% year on year. We extended our unrivaled leadership in mobile with 217 million monthly active users on our mobile commerce apps in September and US$95 billion in mobile GMV for the twelve months ended September 2014. We are also encouraged by continued improvement of mobile monetization which demonstrates the strong commercial intent of our users.” “Our financial performance this quarter was robust, with revenue growing 54% year on year,” said Maggie Wei Wu, chief financial officer of Alibaba Group. “We continue to execute our focused growth strategy, and the fundamental strength of our business gives us the confidence to invest in new initiatives to add new users, improving engagement and customer experience, expand our products and services and drive long-term shareholder value.” September Quarter Operational and Financial Highlights Operational highlights: | | September 30, | | June 30, | | September 30, | | | | | 2013 | | 2014 | | 2014 | | % Change | | | RMB | | RMB | | RMB | | US$(1) | | YoY | | QoQ | | | (in millions, except percentages) | | | | | | | | | | | | | | | | | | | GMV(2) | | 373,659 | | 500,916 | | 555,666 | | 90,529 | | 48.7% | | 10.9% | | Mobile GMV as a percentage of total GMV(2) | | 14.7% | | 32.8% | | 35.8% | | | | | | | | Annual Active Buyers(3) | | 202 | | 279 | | 307 | | | | 52.0% | | 10.0% | | Mobile Monthly Active Users (MAUs)(4) | | 91 | | 188 | | 217 | | | | 138.5% | | 15.4% | | | | | | | | | | | | | |
Financial highlights: | | Three months ended September 30, | | | | | 2013 | | 2014 | | | | | RMB | | RMB | | US$(1) | | YoY % Change | | | (in millions, except percentages and per share amounts) | | | | | | | | | | | | | Revenue | | 10,950 | | 16,829 | | 2,742 | | 53.7% | | Mobile Revenue | | 332 | | 3,719 | | 606 | | 1,020.2% | | | | | | | | | | | Income from Operations | | 5,248 | | 4,345 | | 708 | | (17.2%)* | | | | | | | | | | | Non-GAAP EBITDA(5) | | 6,505 | | 8,493 | | 1,384 | | 30.6% | | Non-GAAP EBITDA Margin(5) | | 59.4% | | 50.5% | | | | | | | | | | | | | | | Net Income | | 4,937 | | 3,030 | | 494 | | (38.6%)* | | Non-GAAP Net Income(5) | | 5,893 | | 6,808 | | 1,109 | | 15.5% | | | | | | | | | | | Diluted Earnings per Share/ADS (EPS) | | 2.13 | | 1.24 | | 0.20 | | (41.8%)* | | Non-GAAP Diluted EPS(5) | | 2.55 | | 2.79 | | 0.45 | | 9.4% |
_______________ | * | | Decrease primarily due to the significant increase in share-based compensation expense and amortization of intangible assets in the September quarter 2014, as discussed in details below. | | (1) | | This release contains translation of certain Renminbi (“RMB”) into U.S. dollars (“US$”) for the convenience of the reader. Unless otherwise stated, all translations of RMB into US$ were made at RMB6.1380 to US$1.00, the exchange rate set forth in the H.10 statistical release of the Federal Reserve Board on September 30, 2014. The percentages stated in this release are calculated based on the RMB amounts. | | (2) | | For the three months ended on the respective dates. Based on the aggregate value of confirmed orders of products and services on our marketplaces, regardless of how, or whether, the buyer and seller settle the transaction. | | (3) | | For the twelve months ended on the respective dates. Active buyers are user accounts that confirmed one or more orders on the relevant marketplace in that period, regardless of whether or not the buyer and seller settle the transaction. | | (4) | | For the month ended on the respective dates. Based on the aggregate mobile MAUs of apps that contribute GMV on our China retail marketplaces. | | (5) | | See the sections entitled “Non-GAAP Financial Measures” and “Reconciliations of Non-GAAP Measures to the Nearest Comparable GAAP Measures” for more information about the non-GAAP measures referred to within this release. | | | |
GMV – GMV transacted on our China retail marketplaces in the quarter ended September 30, 2014 was RMB555,666 million (US$90,529 million), an increase of 48.7% compared to the same quarter of 2013. GMV transacted on Taobao Marketplace in the quarter ended September 30, 2014 was RMB379,832 million (US$61,882 million), an increase of 38.2% compared to the same quarter of 2013. GMV transacted on Tmall in the quarter ended September 30, 2014 was RMB175,834 million (US$28,647 million), an increase of 77.8% compared to the same quarter of 2013. The growth was primarily driven by an increase in number of active buyers. Mobile GMV – Mobile GMV in the quarter ended September 30, 2014 was RMB199,054 million (US$32,430 million), or 35.8% of total GMV transacted on our China retail marketplaces in this quarter, compared to 32.8% in the quarter ended June 30, 2014 and 14.7% in the same quarter of 2013. The growth was primarily driven by increases in the monthly active users accessing our platforms through mobile devices. Annual active buyers – China retail marketplaces had 307 million annual active buyers in the twelve months ended September 30, 2014, compared to 279 million in the twelve months ended June 30, 2014 and 202 million in the twelve months ended September 30, 2013, representing an increase of 52.0% compared to the same period in 2013. Mobile MAUs – Mobile MAUs grew to 217 million in the month ended September 30, 2014, compared to 188 million in the month ended June 30, 2014, representing a net addition of 29 million MAUs in three months, and a 138.5% increase from 91 million in the month ended September 30, 2013. Revenue – Revenue increased by 53.7% to RMB16,829 million (US$2,742 million) in the quarter ended September 30, 2014, compared to RMB10,950 million in the same quarter of 2013. Revenue from China commerce retail business increased by 47.7% to RMB12,769 million (US$2,080 million), compared to RMB8,645 million in the same quarter of 2013, mainly driven by the growth in online marketing service revenue and commission revenue. Mobile revenue increased by 1,020.2% to RMB3,719 million (US$606 million) in the quarter ended September 30, 2014, compared to RMB332 million in the same quarter of 2013. Income from operations – Income from operations in the quarter ended September 30, 2014 was RMB4,345 million (US$708 million), or 25.8% of revenue, a decrease of 17.2% compared to RMB5,248 million in the same quarter of 2013. The decrease was primarily due to share-based compensation charges (see “Share-based compensation expense” below) and an increase in amortization of intangible assets. Non-GAAP EBITDA – Non-GAAP EBITDA increased by 30.6% to RMB8,493 million (US$1,384 million) in the quarter ended September 30, 2014, compared to RMB6,505 million in the same quarter of 2013. Non-GAAP EBITDA margin was 50.5% in the quarter ended September 30, 2014. This was a decrease from 59.4% in the September quarter of 2013 and from 54.4% in the June quarter of 2014. The decrease in non-GAAP EBITDA margin was primarily due to (i) the consolidation of newly acquired businesses, mainly including UCWeb Inc., or UCWeb, AutoNavi Holding Limited, or AutoNavi, (ii) planned investments in new business initiatives, such as our mobile operating system, local services and digital entertainment, and (iii) increased tactical marketing spending during the September quarter. Net income – Our net income in the quarter ended September 30, 2014 was RMB3,030 million (US$494 million), a decrease of 38.6% compared to RMB4,937 million in the same quarter of 2013. The decrease was primarily due to the share-based compensation charges and increased amortization expense as discussed above, and an increase in our effective tax rate. Non-GAAP net income – Non-GAAP net income increased by 15.5% to RMB6,808 million (US$1,109 million) in the quarter ended September 30, 2014, compared to RMB5,893 million in the same quarter of 2013. Diluted EPS and non-GAAP diluted EPS – Diluted EPS in the quarter ended September 30, 2014 was RMB1.24 (US$0.20) on 2,438 million diluted shares outstanding, a decrease of 41.8% compared to RMB2.13 on 2,317 million diluted shares outstanding in the same quarter of 2013. Non-GAAP diluted EPS in the quarter ended September 30, 2014 was RMB2.79 (US$0.45) on 2,438 million diluted shares outstanding, an increase of 9.4% compared to RMB2.55 on 2,317 million diluted shares outstanding in the same quarter of 2013. September Quarter Financial Results Revenue – Revenue for the quarter ended September 30, 2014 was RMB16,829 million (US$2,742 million), an increase of 53.7% compared to RMB10,950 million in the same quarter of 2013. The increase was mainly driven by the continuing rapid growth of our China commerce retail business. - China commerce retail business – Revenue from China commerce retail business in the quarter ended September 30, 2014 was RMB12,769 million (US$2,080 million), or 75.9% of total revenue, an increase of 47.7% compared to RMB8,645 million in the same quarter of 2013. The increase was mainly driven by the growth in online marketing services revenue and commission revenue. Commission revenue accounted for 33.5% of China commerce retail revenue in the quarter ended September 30, 2014, compared to 24.8% in the same quarter of 2013. Revenue growth during this period occurred in the context of and reflected an increase of 48.7% in GMV transacted on our China retail marketplaces, which was primarily driven by a 52.0% increase in the number of active buyers. Monetization rate remained stable at 2.30% in the quarter ended September 30, 2014, compared to 2.31% in the same quarter of 2013. Mobile revenue in the quarter ended September 30, 2014 was RMB3,719 million (US$606 million), representing 29.1% of China commerce retail business revenue, compared to 19.4% in the quarter ended June 30, 2014 and 3.8% in the same quarter of 2013. Mobile revenue increased as a result of increased mobile GMV and increased mobile monetization rate to 1.87%, up from 1.49% in the quarter ended June 30, 2014 and 0.61% in the same quarter of 2013.
- China commerce wholesale business – Revenue from our China commerce wholesale business in the quarter ended September 30, 2014 was RMB790 million (US$129 million), an increase of 39.1% compared to RMB568 million in the same quarter of 2013. The increase in revenue was due to an increase in paying members and an increase in average revenue from paying members.
- International commerce retail business – Revenue from our international commerce retail business in the quarter ended September 30, 2014 was RMB419 million (US$68 million), nearly doubling from RMB210 million in the same quarter of 2013. The main reason for this increase was an increase in GMV transacted on AliExpress.
- International commerce wholesale business – Revenue from our international commerce wholesale business in the quarter ended September 30, 2014 was RMB1,198 million (US$195 million), an increase of 24.0% compared to RMB966 million in the same quarter of 2013. The main reason for this increase was an increase in the number of paying members.
Cost of revenue – Cost of revenue in the quarter ended September 30, 2014 was RMB5,596 million (US$912 million), or 33.3% of revenue, compared to RMB3,001 million, or 27.4% of revenue, in the same quarter of 2013. The increase was primarily due to (i) an increase in share-based compensation expense caused by the re-measurement at period end to fair value of share-based awards granted to the employees of Zhejiang Ant Small and Micro Financial Services Company, Ltd., or Ant Financial, and (ii) an increase in co-location, bandwidth and depreciation expenses as a result of our investments in Alibaba Cloud Computing and our data platform. Product development expenses – Product development expenses in the quarter ended September 30, 2014 were RMB2,581 million (US$421 million), or 15.3% of revenue, compared to RMB1,168 million, or 10.7% of revenue in the same quarter of 2013. The increase was primarily due to an increase in payroll and benefit expense including share-based compensation expense. Our product development headcount increased as we continue to focus on new and existing product development and as a result of our acquisitions of UCWeb and AutoNavi. Sales and marketing expenses – Sales and marketing expenses in the quarter ended September 30, 2014 were RMB1,749 million (US$285 million), or 10.4% of revenue, compared to RMB657 million, or 6.0% of revenue in the same quarter of 2013. The increase was primarily due to an increase in tactical advertising and promotional spending mainly to promote our China retail marketplaces during this quarter when intense global interest in Alibaba enhanced the effectiveness of marketing campaigns. Additionally, the consolidation of marketing expense in acquired businesses, including UCWeb and AutoNavi, and an increase in promoting new business initiatives (including local services and digital entertainment) also contributed to the increase of sales and marketing expenses in this quarter. General and administrative expenses – General and administrative expenses in the quarter ended September 30, 2014 were RMB1,960 million (US$319 million), or 11.6% of revenue, compared to RMB793 million, or 7.2% of revenue in the same quarter of 2013. The increase was primarily due to an increase in share-based compensation expense. Share-based compensation expense – Share-based compensation expense included in respective cost or expense items above in the quarter ended September 30, 2014 was RMB3,010 million (US$490 million), or 17.9% of revenue, an increase of 248.4% compared to RMB864 million, or 7.9% of revenue, in the same quarter of 2013. Share-based compensation expense as a percentage of revenue increased due to performance-based and retention grants of share-based awards to our employees and members of executive management prior to our initial public offering, with vesting periods ranging from four to six years, as well as the re-measurement charge relating to share-based awards granted to the employees of Ant Financial as described under Cost of Revenue above. Amortization of intangible assets – Amortization of intangible assets in the quarter ended September 30, 2014 was RMB598 million (US$97 million), a significant increase from RMB39 million in the same quarter of 2013. The increase was primarily related to the strategic acquisitions, including UCWeb and AutoNavi. Income from operations – Income from operations in the quarter ended September 30, 2014 was RMB4,345 million (US$708 million), or 25.8% of revenue, a decrease of 17.2% compared to RMB5,248 million, or 47.9% of revenue, in the same quarter of 2013. The decrease was primarily due to an increase in share-based compensation expense and an increase in amortization of intangible assets. Non-GAAP EBITDA – Non-GAAP EBITDA increased by 30.6% to RMB8,493 million (US$1,384 million) in the quarter ended September 30, 2014, compared to RMB6,505 million in the same quarter of 2013. Non-GAAP EBITDA margin was 50.5% in the quarter ended September 30, 2014. This was a decrease from 59.4% in the September quarter of 2013 and from 54.4% in the June quarter of 2014. The decrease in non-GAAP EBITDA margin was primarily due to (i) the consolidation of newly acquired businesses, mainly including UCWeb and AutoNavi, (ii) planned investments in new business initiatives, such as our mobile operating system, local services and digital entertainment, and (iii) increased tactical marketing spending during the September quarter. A reconciliation of income from operations to non-GAAP EBITDA is included at the end of this release. Interest and investment income, net – Interest and investment income, net in the quarter ended September 30, 2014 was RMB468 million (US$76 million), an increase of 47.2% compared to RMB318 million in the same quarter of 2013. The increase in net interest and investment income was primarily due to a net gain recognized with respect to the revaluation of previously held equity interests relating to the merger of AutoNavi, and an increase in interest income as a result of higher cash balance during the period, partially offset by losses recognized with respect to the revaluation of convertible bonds in connection with our strategic investments in publicly traded entities. Interest expense – Interest expense in the quarter ended September 30, 2014 was RMB521 million (US$85 million), an increase of 39.3% compared to RMB374 million in the same quarter of 2013. The increase in interest expense was primarily due to an increase in average loan amount outstanding during the period following the drawdown in April 2014 of the remaining US$3.0 billion under a US$8.0 billion credit facility. Other income, net – Other income, net in the quarter ended September 30, 2014 was RMB378 million (US$62 million), a decrease of 2.8% compared to RMB389 million in the same quarter of 2013. For the quarter ended September 30, 2014, other income, net, primarily included royalty fees and software technology service fees received from Ant Financial which increased to RMB430 million (US$70 million) in the quarter ended September 30, 2014 from RMB204 million in the same quarter of 2013, and RMB195 million of expenses relating to the sale of shares by existing shareholders in our initial public offering. Income tax expenses – Income tax expenses in the quarter ended September 30, 2014 were RMB1,339 million (US$218 million), an increase of 110.2% compared to RMB637 million in the same quarter of 2013. The increase was primarily due to the increase in taxable income from our operations in China. Our effective tax rate increased to 28.7% in the quarter ended September 30, 2014 from 11.4% in the same quarter of 2013. Excluding share-based compensation expense which is not deductible for income tax purposes, and gain on revaluation of investments which are not subject to income tax, our effective tax rate would have been 17.6% in the quarter ended September 30, 2014, compared to 9.9% in the same quarter of 2013. Such increase was primarily because the enterprise income tax, or EIT, exemption period of one of our major subsidiaries expired and such subsidiary became subject to an EIT rate of 12.5% (or 50% of the statutory EIT rate) in calendar year 2014. Net income and non-GAAP net income – As a result of the foregoing, our net income in the quarter ended September 30, 2014 was RMB3,030 million (US$494 million), a decrease of 38.6% compared to RMB4,937 million in the same quarter of 2013. Excluding the effects of share-based compensation expense, amortization of intangible assets and certain other items, non-GAAP net income in the quarter ended September 30, 2014 was RMB6,808 million (US$1,109 million), an increase of 15.5% compared to RMB5,893 million in the same quarter of 2013. A reconciliation of net income to non-GAAP net income is included at the end of this release. Net income attributable to ordinary shareholders – Net income attributable to ordinary shareholders in the quarter ended September 30, 2014 was RMB2,976 million (US$485 million), a decrease of 39.1% compared to RMB4,883 million in the same quarter of 2013. Diluted EPS and non-GAAP diluted EPS – Diluted EPS in the quarter ended September 30, 2014 was RMB1.24 (US$0.20) on 2,438 million diluted shares outstanding, a decrease of 41.8% compared to RMB2.13 on 2,317 million diluted shares outstanding in the same quarter of 2013. Excluding the effects of share-based compensation expense, amortization of intangible assets and certain other items, non-GAAP diluted EPS in the quarter ended September 30, 2014 was RMB2.79 (US$0.45), an increase of 9.4% compared to RMB2.55 in the same quarter of 2013. A reconciliation of diluted EPS to the non-GAAP diluted EPS is included at the end of this release. Cash – As of September 30, 2014, cash, cash equivalents and short-term investments were RMB109,911 million (US$17,906 million), compared to RMB43,632 million as of March 31, 2014. Cash flow from operating activities and free cash flow – Net cash provided by operating activities in the quarter ended September 30, 2014 was RMB5,865 million (US$955 million), an increase of 29.6% compared to RMB4,526 million in the same quarter of 2013. Capital expenditures in the quarter ended September 30, 2014 were RMB3,396 million (US$553 million), compared to RMB1,140 million in the same quarter of 2013. Capital expenditures in the quarter ended September 30, 2014 included cash outflow for acquisition of land use rights and construction in progress of RMB1,703 million. Free cash flow, a non-GAAP measurement of liquidity, in the quarter ended September 30, 2014 was RMB8,938 million (US$1,456 million), an increase of 33.7% compared to RMB6,683 million in the same quarter of 2013. A reconciliation of net cash provided by operating activities to free cash flow, the non-GAAP measure of liquidity, is included at the end of this release. Net cash used in investing activities – During the quarter ended September 30, 2014, net cash used in investing activities of RMB32,555 million (US$5,304 million) mainly included disbursements for short-term investments of RMB13,807 million (US$2,249 million), capital expenditure of RMB3,396 million (US$553 million) as well as investment and acquisition activities of RMB15,912 million (US$2,592 million). The cash outflows related to our previously announced investment and acquisition activities included: (i) the merger of AutoNavi, a leading provider of digital map content and navigation and location-based solutions in China, of RMB6,348 million; (ii) investment in Intime Retail (Group) Company Limited, one of China’s leading department store operators, of RMB4,264 million; (iii) investment in Singapore Post Limited, the national postal service provider in Singapore and a leading provider of ecommerce and logistics solutions in the Asia-Pacific region, of RMB1,548 million; and (iv) investment in Guangzhou Evergrande Football Club, China’s first-ever winner of the Asian Football Confederation Champions League Cup, of RMB1,200 million. Webcast and Conference Call Information A live webcast of the earnings conference call, which will be held shortly following the release of this announcement, can be accessed at http://www.alibabagroup.com/en/ir/earnings. An archived webcast will be available through the same link following the call. A replay of the conference call will be available for two weeks (dial-in number: +1 855-859-2056; conference ID: 24286757). Please visit Alibaba Group’s Investor Relations website at http://www.alibabagroup.com/en/ir/homeon November 4, 2014 to view the earnings release and accompanying slides prior to the conference call. About Alibaba Group Alibaba Group's mission is to make it easy to do business anywhere. The company is the largest online and mobile commerce company in the world in terms of gross merchandise volume. Founded in 1999, the company provides the fundamental technology infrastructure and marketing reach to help businesses leverage the power of the Internet to establish an online presence and conduct commerce with hundreds of millions of consumers and other businesses. Alibaba Group's major businesses include: - Taobao Marketplace (www.taobao.com), China's largest online shopping destination
- Tmall.com (www.tmall.com), China's largest third-party platform for brands and retailers
- Juhuasuan (www.juhuasuan.com), China's most popular online group buying marketplace
- Alitrip (www.alitrip.com), a leading online travel booking platform
- AliExpress (www.aliexpress.com), a global online marketplace for consumers to buy directly from China
- Alibaba.com (www.alibaba.com), China's largest global online wholesale platform for small businesses
- 1688.com (www.1688.com), a leading online wholesale marketplace in China
- Alibaba Cloud Computing (www.aliyun.com), a provider of cloud computing services to businesses and entrepreneurs
Alibaba Group also provides payment and/or escrow services on its marketplaces through its contractual arrangements with Ant Financial Services Group, a related company of Alibaba Group that operates Alipay (www.alipay.com). Through China Smart Logistics (or Zhejiang Cainiao Supply Chain Management Co., Ltd.), a 48%-owned affiliate, Alibaba Group operates a central logistics information system that connects a network of express delivery companies in China. Safe Harbor Statements This announcement contains forward-looking statements. These statements are made under the “safe harbor” provisions of the U.S. Private Securities Litigation Reform Act of 1995. These forward-looking statements can be identified by terminology such as “will,” “expects,” “anticipates,” “future,” “intends,” “plans,” “believes,” “estimates,” “potential,” “continue,” “ongoing,” “targets” and similar statements. Among other things, statements that are not historical facts, including statements about Alibaba’s beliefs and expectations, the business outlook and quotations from management in this announcement, as well as Alibaba’s strategic and operational plans, are or contain forward-looking statements. Alibaba may also make written or oral forward-looking statements in its periodic reports to the U.S. Securities and Exchange Commission (the “SEC”), in press releases and other written materials and in oral statements made by its officers, directors or employees to third parties. Forward-looking statements involve inherent risks and uncertainties. A number of factors could cause actual results to differ materially from those contained in any forward-looking statement, including but not limited to the following: Alibaba’s goals and strategies; Alibaba’s future business development; Alibaba’s ability to maintain the trusted status of its ecosystem, reputation and brand; Alibaba’s ability to retain or increase engagement of buyers, sellers and other participants in its ecosystem and enable new offerings; Alibaba’s ability to successfully monetize traffic on its mobile platform; risks associated with limitation or restriction of services provided by Alipay; risks associated with increased investments in Alibaba’s business; risks associated with acquisitions; privacy and regulatory concerns; competition; security breaches; the continued growth of the e-commerce market in China and globally; and fluctuations in general economic and business conditions in China and globally and assumptions underlying or related to any of the foregoing. Further information regarding these and other risks is included in Alibaba’s filings with the SEC. All information provided in this press release and in the attachments is as of the date of this press release and are based on assumptions that we believe to be reasonable as of this date, and Alibaba does not undertake any obligation to update any forward-looking statement, except as required under applicable law. Non-GAAP Financial Measures To supplement its consolidated financial statements, which are prepared and presented in accordance with GAAP, Alibaba Group uses the following non-GAAP financial measures: non-GAAP EBITDA (including non-GAAP EBITDA margin), non-GAAP net income, non-GAAP diluted EPS and free cash flow. For more information on these non-GAAP financial measures, please refer to the table captioned “Reconciliations of Non-GAAP Measures to the Nearest Comparable GAAP Measures” in this press release. Alibaba Group believes that non-GAAP EBITDA, non-GAAP net income and non-GAAP diluted EPS help identify underlying trends in its business that could otherwise be distorted by the effect of the expenses that Alibaba Group includes in income from operations, net income and diluted EPS. Alibaba Group believes that non-GAAP EBITDA, non-GAAP net income and non-GAAP diluted EPS provide useful information about its operating results, enhance the overall understanding of its past performance and future prospects and allow for greater visibility with respect to key metrics used by our management in its financial and operational decision-making. Alibaba Group considers free cash flow to be a liquidity measure that provides useful information to management and investors about the amount of cash generated by its business that can be used for strategic corporate transactions, including investing in its new business initiatives, making strategic investments and acquisitions and strengthening its balance sheet. Non-GAAP EBITDA, non-GAAP net income, non-GAAP diluted EPS and free cash flow should not be considered in isolation or construed as an alternative to net income, diluted EPS, cash flows or any other measure of performance or as an indicator of Alibaba Group’s operating performance. These non-GAAP financial measures presented here may not be comparable to similarly titled measures presented by other companies. Other companies may calculate similarly titled measures differently, limiting their usefulness as comparative measures to our data. Non-GAAP EBITDA represents income from operations (which excludes interest and investment income, net, interest expense, other income, net, income tax expenses and share of results of equity investees) before certain non-cash expenses, consisting of share-based compensation expense, amortization, depreciation and impairment of goodwill and intangible assets that Alibaba Group does not believe are reflective of its core operating performance during the periods presented. Non-GAAP net income represents net income before share-based compensation expense, amortization, impairment of goodwill, intangible assets and investments, gain (loss) on deemed disposals/disposals/revaluation of investments, amortization of excess value receivable arising from the restructuring of commercial arrangement with Ant Financial, and a one-time expense item consisting of the expenses relating to the sale of shares by existing shareholders in our initial public offering. Non-GAAP diluted EPS represents non-GAAP net income attributable to ordinary shareholders divided by the weighted average number of shares outstanding during the periods on a diluted basis, including accounting for the effects of the assumed conversion of convertible preference shares. Free cash flow represents net cash provided by operating activities as presented in Alibaba Group’s consolidated cash flow statement less purchases of property and equipment and intangible assets (excluding acquisition of land use rights and construction in progress) and adjusted for changes in loan receivables relating to micro loans of its SME loan business. Alibaba Group presents the adjustment for changes in loan receivables because such receivables are reflected under cash flow from operating activities, whereas the secured borrowings and other bank borrowings used to finance them are reflected under cash flows from financing activities, and accordingly, the adjustment is made to show cash flows from operating activities net of the effect of changes in loan receivables. The tables captioned “Reconciliations of Non-GAAP Measures to the Nearest Comparable GAAP Measures” in this press release has more details on the non-GAAP financial measures that are most directly comparable to GAAP financial measures and the related reconciliations between these financial measures. ALIBABA GROUP HOLDING LIMITED UNAUDITED INTERIM CONSOLIDATED INCOME STATEMENTS | | Three months ended September 30, | | Six months ended September 30, | | | 2013 | | 2014 | | 2013 | | 2014 | | | RMB | | RMB | | US$ | | RMB | | RMB | | US$ | | | (in millions, except per share data) | | (in millions, except per share data) | | | | | | | | | | | | | | | | | | | | | | | | | | | | Revenue | | 10,950 | | 16,829 | | 2,742 | | 21,728 | | 32,600 | | 5,311 | | | | | | | | | | | | | | Cost of revenue | | (3,001) | | (5,596) | | (912) | | | | (10,181) | | (1,658) | | Product development expenses | | (1,168) | | (2,581) | | (421) | | (2,186) | | (4,533) | | (739) | | Sales and marketing expenses | | (657) | | (1,749) | | (285) | | | | (2,961) | | (482) | | General and administrative expenses | | (793) | | (1,960) | | (319) | | | | (2,904) | | (473) | | Amortization of intangible assets | | (39) | | (598) | | (97) | | | | (832) | | (136) | | Impairment of goodwill and intangible assets | | (44) | | - | | - | | | | - | | - | | |
| |
| |
| | | | | | | | Income from operations | | 5,248 | | 4,345 | | 708 | | 10,668 | | 11,189 | | 1,823 | | Interest and investment income, net | | 318 | | 468 | | 76 | | 784 | | 7,296 | | 1,189 | | Interest expense | | (374) | | (521) | | (85) | | | | (931) | | (152) | | Other income, net | | 389 | | 378 | | 62 | | 630 | | 1,089 | | 177 | | |
| |
| |
| | | | | | | | Income before income tax and share of results of equity investees | | 5,581 | | 4,670 | | 761 | | 10,627 | | 18,643 | | 3,037 | | Income tax expenses | | (637) | | (1,339) | | (218) | | | | (2,784) | | (453) | | Share of results of equity investees | | (7) | | (301) | | (49) | | | | (391) | | (64) | | |
| |
| |
| | | | | | | | Net income | | 4,937 | | 3,030 | | 494 | | 9,385 | | 15,468 | | 2,520 | | Net income attributable to noncontrolling interests | | 6 | | (2) | | - | | 2 | | (36) | | (6) | | |
| |
| |
| | | | | | | | Net income attributable to Alibaba Group Holding Limited | | 4,943 | | 3,028 | | 494 | | 9,387 | | 15,432 | | 2,514 | | Accretion of Convertible Preference Shares | | (8) | | (7) | | (1) | | | | (15) | | (2) | | Dividends accrued on Convertible Preference Shares | | (52) | | (45) | | (8) | | | | (97) | | (16) | | |
| |
| |
| | | | | | | | Net income attributable to ordinary shareholders | | 4,883 | | 2,976 | | 485 | | 9,267 | | 15,320 | | 2,496 | | |
| |
| |
| | | | | | | | Earnings per share attributable to ordinary shareholders | |
| |
| |
| | | | | | | | Basic | | 2.26 | | 1.33 | | 0.22 | | 4.28 | | 6.91 | | 1.13 | | Diluted | | 2.13 | | 1.24 | | 0.20 | | 4.06 | | 6.40 | | 1.04 | | | | | | | | | | | | | | | Weighted average number of share used in calculating net income per ordinary share | | | | | | | | | | | | | | Basic | | 2,165 | | 2,238 | | | | 2,166 | | 2,218 | | | | Diluted | | 2,317 | | 2,438 | | | | 2,311 | | 2,411 | | | | | | | | | | | | | | | | | Share-based compensation expense by function: | | | | | | | | | | | | | | Cost of revenue | | 247 | | 1,155 | | 188 | | 398 | | 1,748 | | 285 | | Product development expenses | | 218 | | 700 | | 114 | | 340 | | 945 | | 154 | | Sales and marketing expenses | | 57 | | 173 | | 28 | | 91 | | 235 | | 38 | | General and administrative expenses | | 342 | | 982 | | 160 | | 431 | | 1,155 | | 188 | | |
| |
| |
| | | | | | | Total | | 864 | | 3,010 | | 490 | | 1,260 | | 4,083 | | 665 | | | | | | | | | | | | | |
ALIBABA GROUP HOLDING LIMITED REVENUE The following table sets forth the principal components of our revenue for the periods indicated: | | Three months ended September 30, | | Six months ended September 30, | | | 2013 | | 2014 | | 2013 | | 2014 | | | RMB | | RMB | | US$ | | RMB | | RMB | | US$ | | | (in millions) | | (in millions) | | | | | | | | | | | | China commerce | | | | | | | | | | | | | | Retail (i) | | 8,645 | | 12,769 | | 2,080 | | 17,312 | | 25,408 | | 4,139 | | Wholesale (ii) | | 568 | | 790 | | 129 | | 1,094 | | 1,499 | | 244 | | |
| |
| |
| | | | | | | | Total China commerce | | 9,213 | | 13,559 | | 2,209 | | 18,406 | | 26,907 | | 4,383 | | |
| |
| |
| | | | | | | | International commerce | |
| |
| |
| | | | | | | | Retail (iii) | | 210 | | 419 | | 68 | | 389 | | 777 | | 127 | | Wholesale (iv) | | 966 | | 1,198 | | 195 | | 1,904 | | 2,309 | | 376 | | |
| |
| |
| | | | | | | | Total international commerce | | 1,176 | | 1,617 | | 263 | | 2,293 | | 3,086 | | 503 | | |
| |
| |
| | | | | | | | Cloud computing and Internet infrastructure (v) | | 190 | | 285 | | 47 | | 364 | | 521 | | 85 | | | | | | | | | | | | | | | Others (vi) | | 371 | | 1,368 | | 223 | | 665 | | 2,086 | | 340 | | |
| |
| |
| | | | | | | Total | | 10,950 | | 16,829 | | 2,742 | | 21,728 | | 32,600 | | 5,311 | | |
| |
| |
| |
| | | | |
| | | | | | | | | | | | | (i) | Revenue from China commerce retail is primarily generated from our China retail marketplaces. | (ii) | Revenue from China commerce wholesale is primarily generated from 1688.com. | (iii) | Revenue from International commerce retail is primarily generated from AliExpress. | (iv) | Revenue from International commerce wholesale is primarily generated from Alibaba.com. | (v) | Revenue from cloud computing and Internet infrastructure is primarily generated from the provision of services, such as data storage, elastic computing, database and large scale computing services, as well as web hosting and domain name registration. | (vi) | Other revenue mainly represents interest income generated from micro loans. | | |
ALIBABA GROUP HOLDING LIMITED UNAUDITED INTERIM CONSOLIDATED BALANCE SHEETS | | As of | | | | | March 31, | | As of September 30, | | | 2014 | | 2014 | | | RMB | | RMB | | US$ | | | (in millions) | | | | | | | | | | | | | | | | Assets | | | | | | | | Current assets: | | | |
| |
| | Cash and cash equivalents | | 33,045 | | 88,089 | | 14,351 | | Short-term investments | | 10,587 | | 21,822 | | 3,555 | | Restricted cash and escrow receivables | | 4,921 | | 2,477 | | 404 | | Loan receivables | | 13,159 | | 19,186 | | 3,126 | | Investment securities | | 1,442 | | 1,896 | | 309 | | Prepayments, receivables and other assets | | 4,679 | | 7,944 | | 1,294 | | |
| |
| |
| | Total current assets | | 67,833 | | 141,414 | | 23,039 | | | | | | | | | Investment in equity investees | | 17,666 | | 26,076 | | 4,248 | | Investment securities | | 3,023 | | 9,241 | | 1,506 | | Prepayments, receivables and other assets | | 2,087 | | 4,535 | | 739 | | Property and equipment, net | | 5,581 | | 8,561 | | 1,395 | | Land use rights | | 1,660 | | 1,593 | | 259 | | Intangible assets | | 1,906 | | 7,261 | | 1,183 | | Goodwill | | 11,793 | | 33,661 | | 5,484 | | | | |
| |
| | Total assets |
| 111,549 | | 232,342 | | 37,853 | | |
| |
| |
| | Liabilities, Mezzanine Equity and Shareholders’ Equity | |
| | | | | | Current liabilities: | |
| | | | | | Current bank borrowings | | 1,100 | | 3,767 | | 614 | | Secured borrowings | | 9,264 | | 10,584 | | 1,724 | | Income tax payable | | 1,267 | | 1,441 | | 235 | | Escrow money payable | | 2,659 | | - | | - | | Accrued expenses, accounts payable and other liabilities | | 11,887 | | 17,398 | | 2,834 | | Merchant deposits | | 4,711 | | 6,738 | | 1,098 | | Deferred revenue and customer advances | | 6,496 | | 7,103 | | 1,157 | | |
| |
| |
| | Total current liabilities | | 37,384 | | 47,031 | | 7,662 | | | | | | | | | Deferred revenue | | 428 | | 443 | | 72 | | Deferred tax liabilities | | 2,136 | | 3,594 | | 586 | | Non-current bank borrowings | | 30,711 | | 49,542 | | 8,071 | | Other liabilities | | 72 | | 1,948 | | 317 | | |
| |
| |
| | Total liabilities | | 70,731 | | 102,558 | | 16,708 | | | | | | | |
ALIBABA GROUP HOLDING LIMITED UNAUDITED INTERIM CONSOLIDATED BALANCE SHEETS (CONTINUED) | | As of | | | | | March 31, | | As of September 30, | | | | | 2014 | | | | | RMB | | US$ | | | (in millions) | | | | | | | | | | | | | | | | Commitments and contingencies | | — | | — | | — | | | | | | | | | Mezzanine equity: | | | | | | | | Convertible Preference Shares | | 10,284 | | — | | — | | Others | | 117 | | 336 | | 55 | | |
| |
| |
| | Total mezzanine equity | | 10,401 | | 336 | | 55 | | |
| |
| |
| | Alibaba Group Holding Limited shareholders’ equity: | | | | | | | | Ordinary shares, US$0.000025 par value; 2,797,400,000 and 4,000,000,000 shares authorized; 2,226,810,660 and 2,485,687,304 shares issued and outstanding as of March 31, 2014 and September 30, 2014, respectively | | 1 | | 1 | | — | | Additional paid-in capital | | 27,043 | | 108,132 | | 17,617 | | Treasury shares at cost | | — | | — | | — | | Restructuring reserve | | — | | (1,284) | | (209) | | Subscription receivables | | | | (367) | | (60) | | Statutory reserves | | 2,474 | | 2,521 | | 411 | | Accumulated other comprehensive income | | | | (553) | | (90) | | Retained earnings | | 1,183 | | 16,206 | | 2,640 | | |
| |
| |
| | Total Alibaba Group Holding Limited shareholders’ equity | | 29,338 | | 124,656 | | 20,309 | | Noncontrolling interests | | 1,079 | | 4,792 | | 781 | | |
| |
| |
| | Total equity | | 30,417 | | 129,448 | | 21,090 | | |
| |
| |
| | Total liabilities, mezzanine equity and equity |
| 111,549 | | 232,342 | | 37,853 | | | | | | | |
ALIBABA GROUP HOLDING LIMITED UNAUDITED INTERIM CONDENSED CONSOLIDATED STATEMENTS OF CASH FLOWS | | Three months ended September 30, | | Six months ended September 30, | | | 2013 | | 2014 | | 2013 | | 2014 | | | RMB | | RMB | | US$ | | RMB | | RMB | | US$ | | | (in millions) | | (in millions) | | | | | | | | | | | | Net cash provided by operating activities | | 4,526 | | 5,865 | | 955 | | 9,657 | | 16,042 | | 2,613 | | Net cash used in investing activities | | (5,724) | | (32,555) | | (5,304) | | (16,652) | | (42,965) | | (7,000) | | Net cash provided by financing activities | | 2,297 | | 62,864 | | 10,242 | | 4,819 | | 81,954 | | 13,352 | | Effect of exchange rate changes on cash and cash equivalents | | (17) | | 3 | | 1 | | (101) | | 13 | | 2 | | |
| |
| |
| |
| | | | | | Increase (Decrease) in cash and cash equivalents | | 1,082 | | 36,177 | | 5,894 | | (2,277) | | 55,044 | | 8,967 | | Cash and cash equivalents at beginning of period | | 27,037 | | 51,912 | | 8,457 | | 30,396 | | 33,045 | | 5,384 | | |
| |
| |
| |
| | | | | Cash and cash equivalents at end of period | | 28,119 | | 88,089 | | 14,351 | | 28,119 | | 88,089 | | 14,351 | | | | | | | | | | | | | |
ALIBABA GROUP HOLDING LIMITED RECONCILIATIONS OF NON-GAAP MEASURES TO THE NEAREST COMPARABLE GAAP MEASURES | The table below sets forth a reconciliation of our income from operations to non-GAAP EBITDA for the periods indicated: | | | | | | | | Three months ended September 30, | | Six months ended September 30, | | | 2013 | | 2014 | | 2013 | | 2014 | | | RMB | | RMB | | US$ | | RMB | | RMB | | US$ | | | (in millions) | | (in millions) | | | | | | | | | | | | Income from operations | | 5,248 | | 4,345 | | 708 | | 10,668 | | 11,189 | | 1,823 | | Add: Share-based compensation expense | | 864 | | 3,010 | | 490 | | 1,260 | | 4,083 | | 665 | | Add: Amortization of intangible assets | | 39 | | 598 | | 97 | | 74 | | 832 | | 136 | | Add: Depreciation and amortization of property and equipment and land use rights | | 310 | | 540 | | 89 | | 553 | | 963 | | 157 | | Add: Impairment of goodwill and intangible assets | | 44 | | - | | - | | 44 | | - | | - | | |
| |
| |
| | | | | | | Non-GAAP EBITDA | | 6,505 | | 8,493 | | 1,384 | | 12,599 | | 17,067 | | 2,781 | | |
| |
| |
| |
| | | | | | | | | | | | | | | | | | | The table below sets forth a reconciliation of our net income to non-GAAP net income for the periods indicated: | | | | | | | | | | | | | | | | Three months ended September 30, | | Six months ended September 30, | | | 2013 | | 2014 | | 2013 | | 2014 | | | RMB | | RMB | | US$ | | RMB | | RMB | | US$ | | | (in millions) | | (in millions) | | | | | | | | | | | | | | | | | | | | | | | | | | | | Net income | | 4,937 | | 3,030 | | 494 | | 9,385 | | 15,468 | | 2,520 | | Add: Share-based compensation expense | | 864 | | 3,010 | | 490 | | 1,260 | | 4,083 | | 665 | | Add: Amortization of intangible assets | | 39 | | 598 | | 97 | | 74 | | 832 | | 136 | | Add: Impairment of goodwill, intangible assets and investments | | 53 | | - | | - | | 69 | | - | | - | | Add: (Gain) loss on deemed disposals/disposals/ revaluation of investments | | - | | (60) | | (9) | | (312) | | (6,488) | | (1,057) | | Add: Amortization of excess value receivable arising from the restructuring of commercial arrangements with Ant Financial | | - | | 35 | | 6 | | - | | 35 | | 6 | | Add: Expenses relating to the sale of shares by existing shareholders in initial public offering | | - | | 195 | | 31 | | - | | 195 | | 31 | | |
| |
| |
| | | | | | | Non-GAAP net income | | 5,893 | | 6,808 | | 1,109 | | 10,476 | | 14,125 | | 2,301 | | | | | | | | | | | | | |
ALIBABA GROUP HOLDING LIMITED RECONCILIATIONS OF NON-GAAP MEASURES TO THE NEAREST COMPARABLE GAAP MEASURES (CONTINUED) | The table below sets forth a reconciliation of our diluted EPS to non-GAAP diluted EPS for the periods indicated: | | | | | | | | | | | | | | | | | | Three months ended September 30, | | Six months ended September 30, | | | | 2013 | | 2014 | | 2013 | | 2014 | | | | RMB | | RMB | | US$ | | RMB | | RMB | | US$ | | | | (in millions, except per share data) | | (in millions, except per share data) | | | | | | | | | | | | | | | | | | | | | | | | | | | | | | Net income attributable to ordinary shareholders | | 4,883 | | 2,976 | | 485 | | 9,267 | | 15,320 | | 2,496 | | Add: Reversal of accretion upon assumed conversion of Convertible Preference Shares | | 8 | | 7 | | 1 | | 16 | | 15 | | 2 | | Add: Dividend eliminated upon assumed conversion of Convertible Preference Shares | | 52 | | 45 | | 8 | | 104 | | 97 | | 16 | | | |
| |
| |
| | | | | | | | Net income attributable to ordinary shareholders for computing diluted EPS | | 4,943 | | 3,028 | | 494 | | 9,387 | | 15,432 | | 2,514 | | Add: Non-GAAP adjustments to net income(a) | | 956 | | 3,778 | | 615 | | 1,091 | | (1,343) | | (219) | | | |
| |
| |
| | | | | | | | Non-GAAP net incomeattributable to ordinary shareholders for computing non-GAAP diluted EPS | | 5,899 | | 6,806 | | 1,109 | | 10,478 | | 14,089 | | 2,295 | | | |
| |
| |
| | | | | | | | | | | | | | | | | | | | | Weighted average number of shares on a diluted basis | | 2,317 | | 2,438 | | | | 2,311 | | 2,411 | | | |
| |
| |
| |
| | | | | | | | Diluted EPS(b) | | 2.13 | | 1.24 | | 0.20 | | 4.06 | | 6.40 | | 1.04 | | Add: Non-GAAP adjustments to net income per share(c) | | 0.42 | | 1.55 | | 0.25 | | 0.47 | | (0.56) | | (0.09) | | | |
| |
| |
| | | | | | | Non-GAAP diluted EPS(d) | | 2.55 | | 2.79 | | 0.45 | | 4.53 | | 5.84 | | 0.95 | | | |
| |
| |
| |
| | | | | | | | | | | | | | | | | | | (a) | See the table above about the reconciliation of net income to non-GAAP net income for more information of these non-GAAP adjustments. | (b) | Diluted EPS is derived from net income attributable to ordinary shareholders for computing diluted EPS divided by weighted average number of shares on a diluted basis. | (c) | Non-GAAP adjustments to net income per share is derived from non-GAAP adjustments to net income divided by weighted average number of shares on a diluted basis. | (d) | Non-GAAP diluted EPS is derived from non-GAAP net income attributable to ordinary shareholders for computing non-GAAP diluted EPS divided by weighted average number of shares on a diluted basis. | | | | | | | | | | | | | | | | | | | | | | | | | | | | | | The table below sets forth a reconciliation of net cash provided by operating activities to free cash flow for the periods indicated: | | | | | | | | | | | | | | | | | | Three months ended September 30, | | Six months ended September 30, | | | | 2013 | | 2014 | | 2013 | | 2014 | | | | RMB | | RMB | | US$ | | RMB | | RMB | | US$ | | | | | | | | | | | | | | | | | | | | Net cash provided by operating activities | | 4,526 | | 5,865 | | 955 | | 9,657 | | 16,042 | | 2,613 | | Less: Purchase of property and equipment and intangible assets (excluding land use rights and construction in progress) | | (996) | | (1,693) | | (276) | | (1,823) | | (2,848) | | (464) | | Add: Changes in loan receivables, net | | 3,153 | | 4,766 | | 777 | | 4,939 | | 6,338 | | 1,033 | | | |
| |
| |
| | | | | | | Free cash flow | | 6,683 | | 8,938 | | 1,456 | | 12,773 | | 19,532 | | 3,182 | | | | | | | | | | | | | |
ALIBABA GROUP HOLDING LIMITED SELECTED OPERATING DATA GMV | The table below sets forth the GMV transacted on our China retail marketplaces and mobile GMV as a percentage of GMV for the periods indicated: | | | Three months ended | | | Jun 30, | | Sep 30, | | Dec 31, | | Mar 31, | | Jun 30, | | Sep 30, | | Dec 31, | | Mar 31, | | Jun 30, | | Sep 30, | | | 2012 | | 2012 | | 2012 | | 2013 | | 2013 | | 2013 | | 2013 | | 2014 | | 2014 | | 2014 | | | (in billions of RMB except percentages) | | GMV | | | | | | | | | | | | | | | | | | | | | | Taobao Marketplace GMV | | 167 | | 179 | | 255 | | 223 | | 257 | | 275 | | 346 | | 295 | | 342 | | 380 | | Tmall GMV | | 42 | | 49 | | 91 | | 71 | | 88 | | 99 | | 183 | | 135 | | 159 | | 176 | | Total GMV | | 209 | | 228 | | 346 | | 294 | | 345 | | 374 | | 529 | | 430 | | 501 | | 556 | | | | | | | | | | | | | | | | | | | | | | | Mobile GMV (as a percentage of total GMV) | | 4.6% | | 5.6% | | 7.4% | | 10.7% | | 12.0% | | 14.7% | | 19.7% | | 27.4% | | 32.8% | | 35.8% | | | | | | | | | | | | | | | | | | | | | |
Annual active buyers | The table below sets forth the number of active buyers on our China retail marketplaces for the periods indicated: | | | | | | Twelve months ended | | | Jun 30, | | Sep 30, | | Dec 31, | | Mar 31, | | Jun 30, | | Sep 30, | | Dec 31, | | Mar 31, | | Jun 30, | | Sep 30, | | | 2012 | | 2012 | | 2012 | | 2013 | | 2013 | | 2013 | | 2013 | | 2014 | | 2014 | | 2014 | | | (in millions) | | Annual active buyers | | 133 | | 145 | | 160 | | 172 | | 185 | | 202 | | 231 | | 255 | | 279 | | 307 | | | | | | | | | | | | | | | | | | | | | |
Mobile | The table below sets forth information with respect to mobile GMV, mobile revenue and mobile rates of monetization realized in respect of our China retail marketplaces for the periods presented: | | | | | | Three months ended | | | Jun 30, | | Sep 30, | | Dec 31, | | Mar 31, | | Jun 30, | | Sep 30, | | Dec 31, | | Mar 31, | | Jun 30, | | Sep 30, | | | 2012 | | 2012 | | 2012 | | 2013 | | 2013 | | 2013 | | 2013 | | 2014 | | 2014 | | 2014 | | | (in millions of RMB except percentages) | | China retail marketplaces: | | | | | | | | | | | | | | | | | | | | | | GMV | | 209,221 | | 228,068 | | 345,696 | | 294,184 | | 345,134 | | 373,659 | | 528,709 | | 430,085 | | 500,916 | | 555,666 | | Mobile GMV | | 9,583 | | 12,703 | | 25,661 | | 31,507 | | 41,299 | | 54,823 | | 104,391 | | 118,001 | | 164,428 | | 199,054 | | as a percentage of GMV | | 4.6% | | 5.6% | | 7.4% | | 10.7% | | 12.0% | | 14.7% | | 19.7% | | 27.4% | | 32.8% | | 35.8% | | | | | | | | | | | | | | | | | | | | | | | Revenue | | 5,028 | | 5,600 | | 9,588 | | 6,754 | | 8,667 | | 8,645 | | 16,149 | | 9,371 | | 12,639 | | 12,769 | | Mobile revenue | | 42 | | 60 | | 140 | | 147 | | 240 | | 332 | | 1,171 | | 1,162 | | 2,454 | | 3,719 | | as a percentage of revenue | | 0.8% | | 1.1% | | 1.5% | | 2.2% | | 2.8% | | 3.8% | | 7.3% | | 12.4% | | 19.4% | | 29.1% | | | | | | | | | | | | | | | | | | | | | | | Monetization rate | | 2.40% | | 2.46% | | 2.77% | | 2.30% | | 2.51% | | 2.31% | | 3.05% | | 2.18% | | 2.52% | | 2.30% | | Mobile monetization rate | | 0.44% | | 0.47% | | 0.55% | | 0.47% | | 0.58% | | 0.61% | | 1.12% | | 0.98% | | 1.49% | | 1.87% |
Contact:Investor Relations Contacts
Grace Wong, +852 2215 5100
investor@alibabagroup.com
or
Media Contacts
Robert Christie
bob.christie@alibaba-inc.com
|


